The KSL Surfability Score is designed to answer the question every surfer asks before paddling out:
How good are the waves right now?
Instead of piecing together swell charts, wind reports, and tide tables, the Surfability Score brings those moving parts together into a single, easy-to-understand signal. It reflects how well ocean conditions are lining up at a specific surf break.
The Surfability Score is a numerical rating that represents how rideable the waves are likely to be at a given location.
It is based on the same concept as surfability, which describes how swell direction, wind conditions, and tide interact to shape wave quality.
→ Learn more about surfability
The difference is that the Surfability Score takes that idea and turns it into something measurable.
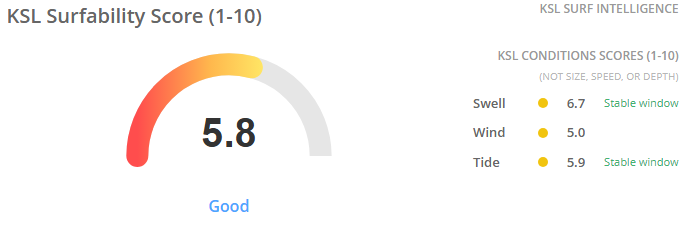
At its core, the Surfability Score evaluates how well key ocean conditions align at a surf break.
The Swell Score measures how well the incoming swell direction and energy match the orientation of the break.
Not all swell hits a spot the same way. When swell approaches from the right angle, waves tend to line up, hold shape, and break more consistently. This is considered the ideal alignment for that break.
As the swell direction moves away from that angle, conditions may still be surfable, but consistency and shape can start to drop off. This falls into a more acceptable range, where waves are still rideable but less predictable.
When swell is significantly off-angle, energy is often lost or scattered, leading to weaker or disorganized waves.
The Wind Score evaluates how wind direction and strength are affecting wave quality at a given break.
Similar to the Swell Score, wind conditions fall into an ideal range, an acceptable range, and a range where conditions begin to break down.
When winds are light or offshore, the surface tends to stay glassy, allowing waves to hold shape and break clean. This is typically the ideal wind window, where conditions look organized and surfable.
As wind shifts sideshore or increases in strength, conditions can still be surfable, but texture starts to build on the surface. This falls into a more acceptable range, where waves may still have shape but lose some consistency.
When winds turn strong onshore, conditions often become blown out, with wave faces breaking down, losing structure, and becoming difficult to ride. In these situations, the Wind Score reflects how much the surface conditions are degrading overall surfability.
Because every break faces a different direction, the Wind Score also considers how wind angle interacts with the orientation of the spot. A wind that is offshore at one break might be sideshore or even onshore at another just down the coast.
The Tide Score evaluates how current water levels align with the preferred tide range of a surf break.
Similar to both the Swell Score and Wind Score, tide conditions fall into an ideal range, an acceptable range, and a range where the wave begins to lose its shape or break inconsistently.
When the tide is within the ideal window, waves tend to break with better shape, timing, and consistency. This is when the structure of the break is working with the incoming swell, allowing waves to form and peel the way surfers expect.
As the tide moves higher or lower away from that window, conditions may still be surfable, but the wave can become less predictable. This is the acceptable range, where some waves still come through clean, but overall consistency starts to drop.
When the tide moves too far outside the preferred range, the character of the wave can change significantly. Too much water can soften the break and cause waves to lose definition, while too little water can make waves close out quickly or expose shallow sections. In these cases, the Tide Score reflects how much the break is moving away from its optimal conditions.
Because every surf spot responds differently to water level, the Tide Score is tuned to how that specific break behaves throughout the tide cycle. Some spots need more water to work properly, while others come alive as the tide drops.
Surfers have always evaluated these factors instinctively.
The Surfability Score pulls those signals together so you can quickly answer: Is it worth it right now, or should I check another spot?
Instead of guessing, or cruising from break to break, you can compare conditions across multiple breaks in seconds.
The KSL Surfability Score ranges from lower to higher values that reflect overall wave quality.
This makes it easier to scan multiple locations and spot where conditions are peaking.
The Surfability Score is applied across KSL surf reports so you can move from data to decision quickly.
You can:
→ Explore current surf reports and surfability scores
This is where the Surfability Score becomes practical. It helps you spend less time analyzing and more time surfing.
The Surfability Score is part of a broader system known as Surf Intelligence.
This system evaluates how ocean conditions interact at specific surf breaks and translates that information into actionable insight.
By combining structured spot data with real-time conditions, Surf Intelligence helps reveal when waves are actually coming together.
Surf forecasting has always required interpretation.
The Surfability Score simplifies that process.
Instead of asking:
You can start with a clearer question: How surfable is it right now?
The best way to understand the Surfability Score is to see how it behaves across real surf spots.
Watch how the Swell Score, Wind Score, and Tide Score shift throughout the day, and how those changes impact the overall surfability.
Here’s how the Surfability Score comes together in a real surf report.